Shift in progress
ITF found in LOW_NOISE_3_SQZ and in Science Mode. ITF still locked.
Shift in progress
ITF found in LOW_NOISE_3_SQZ and in Science Mode. ITF still locked.
We started at 14:00 UTC and to not interfere with the ITF and risk to unlock, we manually injected the SQZ.
System initial status: ITF LOW NOISE 3; SQZ_MAIN @SQZ_Locked_NO_FC
14:28:26 AA loop engaged
We performed a first CC phase scan (Fig. 1-2):
14:39 CC scan started DCP = 195 Hz
15:02:21 CC scan ended (fast shutter closed), ITF in shot
15:26:15 fast shutter opened
15:36:22 ITF in SQZ phi0 = 0.65 rad
15:39:19 SQB1 TX angle set to 300 (initially at 310)
16:42:58 SQB1 X position set to -3200 (original position)
16:47:58 ITF in SQZ
After the first CC scan we realized the magnitude was similar to the last shift (entry #64094) even though there should be a higher level of injected SQZ. We decided to try to improve the magnitude by acting on SQB1_TX and SQB1_X DOFs. We worked on this from 15:39:19 to 16:42:58 UTC. Finally we left SQB1_X as it was and we changed the set point of SQB1_TX from 310 to 330 urad. The fluctuations on the magnitude are reduced (Fig. 3).
We then performed another phase scan (Fig. 4-5)
17:05 CC scan started DCP = 195 Hz
17:28 CC scan ended (fast shutter closed), ITF in shot
After the second CC scan we realized the SQZ angle is actually around 1.05 rad, so we decided to repeat the SQZ mode acquisition.
17:39:53 fast shutter opened, ITF in SQZ phi0 = 1.05 rad
17:49:08 CC loop engaged, gain=75000 (glitch between 17:54:50 and 17:56:14)
17:58:54 ITF in ASQZ phi0 = 2.75 rad
We were able to get another CC phase scan with DCP setpoint at 225 Hz (Fig. 6-7). Fig. 8 reports also the shot SQZ and ASQZ acquisitions made after the scan.
18:11 DCP value set to 225 Hz
18:44:11 ITF in shot
18:46: CC scan started DCP = 225 Hz
19:09 CC scan ended
19:15:07 ITF in ASQZ phi0 = 2.7 rad
19:22:48 ITF in SQZ phi0 = 0.95 rad
19:28 DCP value set back to 195 Hz
List of activities and actions performed during the shift:
Guard Tour (UTC)
17:08 - 17:37
19:06 - 19:32
Vacuum
16:15UTC lost of signals from 600W Tube Station
I notified A. Pasqualetti who agreed to carried out checks probably not before next maintenance.
In according with him I shelved related flags until Thursday
Figure 1. The CARM noise injection caused SR to move by ~0.5urad, because it made the B1 photodiodes saturate. It needs to be understood how the CARM noise injection shape needs to be changed so it doesn't cause B1 saturations which will spoil the measurement.
Figure 2. Normal daily hrec calibration measurements (between 16:00 UTC and 16:10 UTC) are no longer kicking the SR alignment.
ITF is found in SCIENCE.
At 6:01 UTC I set the ITF in Maintenance Mode, here is the list of the activities communicated to the Control Room:
Periodic Tasks carried out by the Operator:
| CH (W) | Inner DAS (W) | Outer DAS (W) | |
| W Pickoff | 0.255 | 0 | 0.22 |
| N Pickoff | 0.68 | 0.065 | 0.602 |
11:25 UTC Maintenance ended, I re-aligned the CITF and relocked the ITF at the first attempt, back in SCIENCE at 11:35 UTC.
11:58 UTC Vpm restarted
SQZ not working properly, F. Sorrentino contacted H. Valbruch for it.
Sub-system reportsISC
I changed the set-points of NI and WI etalon suggested by M. Mantovani.
12:13 UTC WI new set point 19.825 and NI new set point 20.1
[entry unexpectedly stuck in drafts]
During the night the WI CO2 laser changed the state, but ITF remained locked: Magazzu sent an email and report about the DMS flag in the Virgo logbook (64134).
During this morning maintenance activities were foreseen, so I waited at least for the taking of thermal camera images and chiller refilling before making actions for WI CO2 laser power recovery. After the chiller refilling and filter change, the WI CO2 main laser state was mainly recovered (see Fig. 1).
A further activity was foreseen during maintenance in TCS room (repair WI etalon heating belt, 64114). I waited for the end of this activity to further check CO2 powers (Gianmatteo already checked them 64135) and eventually act on waveplates.
At 09.00 UTC, with ITF in down, I checked all CO2 powers restoring the nominal ones. This activity has been completed at 09.18 UTC.
We have removed the temporary magnetic and seismic probes from the DT turbo, placed there on Feb. 24.
We placed the magnetic probe onto the MC tube (similar location where it had been in the past). The acquired channel is perpendicular to the tube (probe "X"). We used the same name: ENV_CEB_MAG_MC_TUBE.
This morning during the maintenance break, we replaced a fan on the DT turbomolecular pump after noticing some unusual noise, possibly due to a worn bearing. We installed a standard domestic fan, mounted on rubber pads as usual (picture attached)
This morning I slightly tweaked the alignment of the optics showed in entry 56246 inside the AEI sqzueezer board, in order to improve the MZI contrast and the pump beam alignment on the OPA.
I worked on MZI between 7:43 and 7:47 UTC, and on OPA between 7:52 and 8:19 UTC.
The MZI at the beginning was already quite high, and I could only improve it marginally - from 68% to 73%, see first attached plot.
After tweaking the pump beam alignment, the OPA peak trasmission improved by about 5% (see second attached plot) and the main HOM in OPA scan was reduced by a comparable amount (see third attached plot).
ITF found in LOW_NOISE_3_SQZ and in Science Mode. It kept the lock for the whole shift.
Guard Tour (UTC):
21:01 - 21:29
23:02 - 23:29
01:01 - 01:29
03:01 - 03:29
TCS
At around 4:25 UTC the value of TCS_WI_CO2_PWROUT suddenly decreased (see attached plot). Expert informed via mail of the issue.
I found ITF in SCIENCE MODE; It remained locked for the whole shift.
No DMS Events to report
Guard Tour (UTC):
17:08 - 17:35
19:01 - 19:29
The automated noise injections on Friday 26th worked as intended: there were two minutes of noise injection on each longitudinal DoFs (Figs.1-5).
The coherence with Hrec is unsatisfying though (Figs.6-10). A finer tuning of the amplitudes of the noise injections might be necessary.
Figure 1. The CARM noise injection caused SR to move by ~0.5urad, because it made the B1 photodiodes saturate. It needs to be understood how the CARM noise injection shape needs to be changed so it doesn't cause B1 saturations which will spoil the measurement.
Figure 2. Normal daily hrec calibration measurements (between 16:00 UTC and 16:10 UTC) are no longer kicking the SR alignment.
I found ITF in SCIENCE; It remained locked for the whole shift.
I'm repeating the analysis described in #63996 for the second week of O4b. The selected data segment is: 2024-04-20 22:14:40 to 2024-04-21 18:30:12 (72932.0 sec).
As before, I attach the CSV with the identified frequencies and the PDF with the various regions of the spectrum.
In 2017 the PRC was measured to have a wrong length by 3-4mm: https://logbook.virgo-gw.eu/virgo/?r=36884
I have checked in Optickle that mistuning the sideband frequency by a 2 kHz (which should be equivalent to a 4mm cavity length change), the sideband behavior becomes asymetric with PRCL offset. WIth the sideband power increasing by 1-2% in one direction and decreasing by 1-2% in the other direction, when changing the PRCL offset by ~0.2nm. This is similar to the measurements done last Friday, but it disagrees with the PRCL calibration done a year ago: https://logbook.virgo-gw.eu/virgo/?r=36884. That calibration would say that the PRCL offset was changed by 1.5nm, which would make the sideband power change by a few tens of percent. Maybe that calibration is no longer valid, as some normalizing factors could have been changed when chaning PRCL error signal from 8MHz to 6MHz sideband, or when installing the RAMS on the 6MHz.
Figure 1 shows in red the normal situation, in blue with the frequency to amplitude noise coupling divided by ~2 by adding the PRCL offset and in purple by adding the PRCL offset which zeros the coupling. The power fluctuation on B2 at ~1.5Hz improve by a factor 10 when reducing the coupling, on B4 there is also an improvement by a factor ~3, while on B4 12MHz the situation becomes worse, with fluctuations increasing by a factor 2. That would make sense if we improve the resonance condition for the carrier and degrade for the 6MHz sideband.
Figure 2 are the same times but with colors not in the same order. It includes also the B7 and B8 powers, and while on B8 the improvement is monotonic when improving the frequency to amplitude noise conversion, on B7 it is not the case. Is that a consequence of one arm being 3cm shorter than the other?
Lets assume that the PRC length is wrong by ~3mm, there are several options to resolve this:
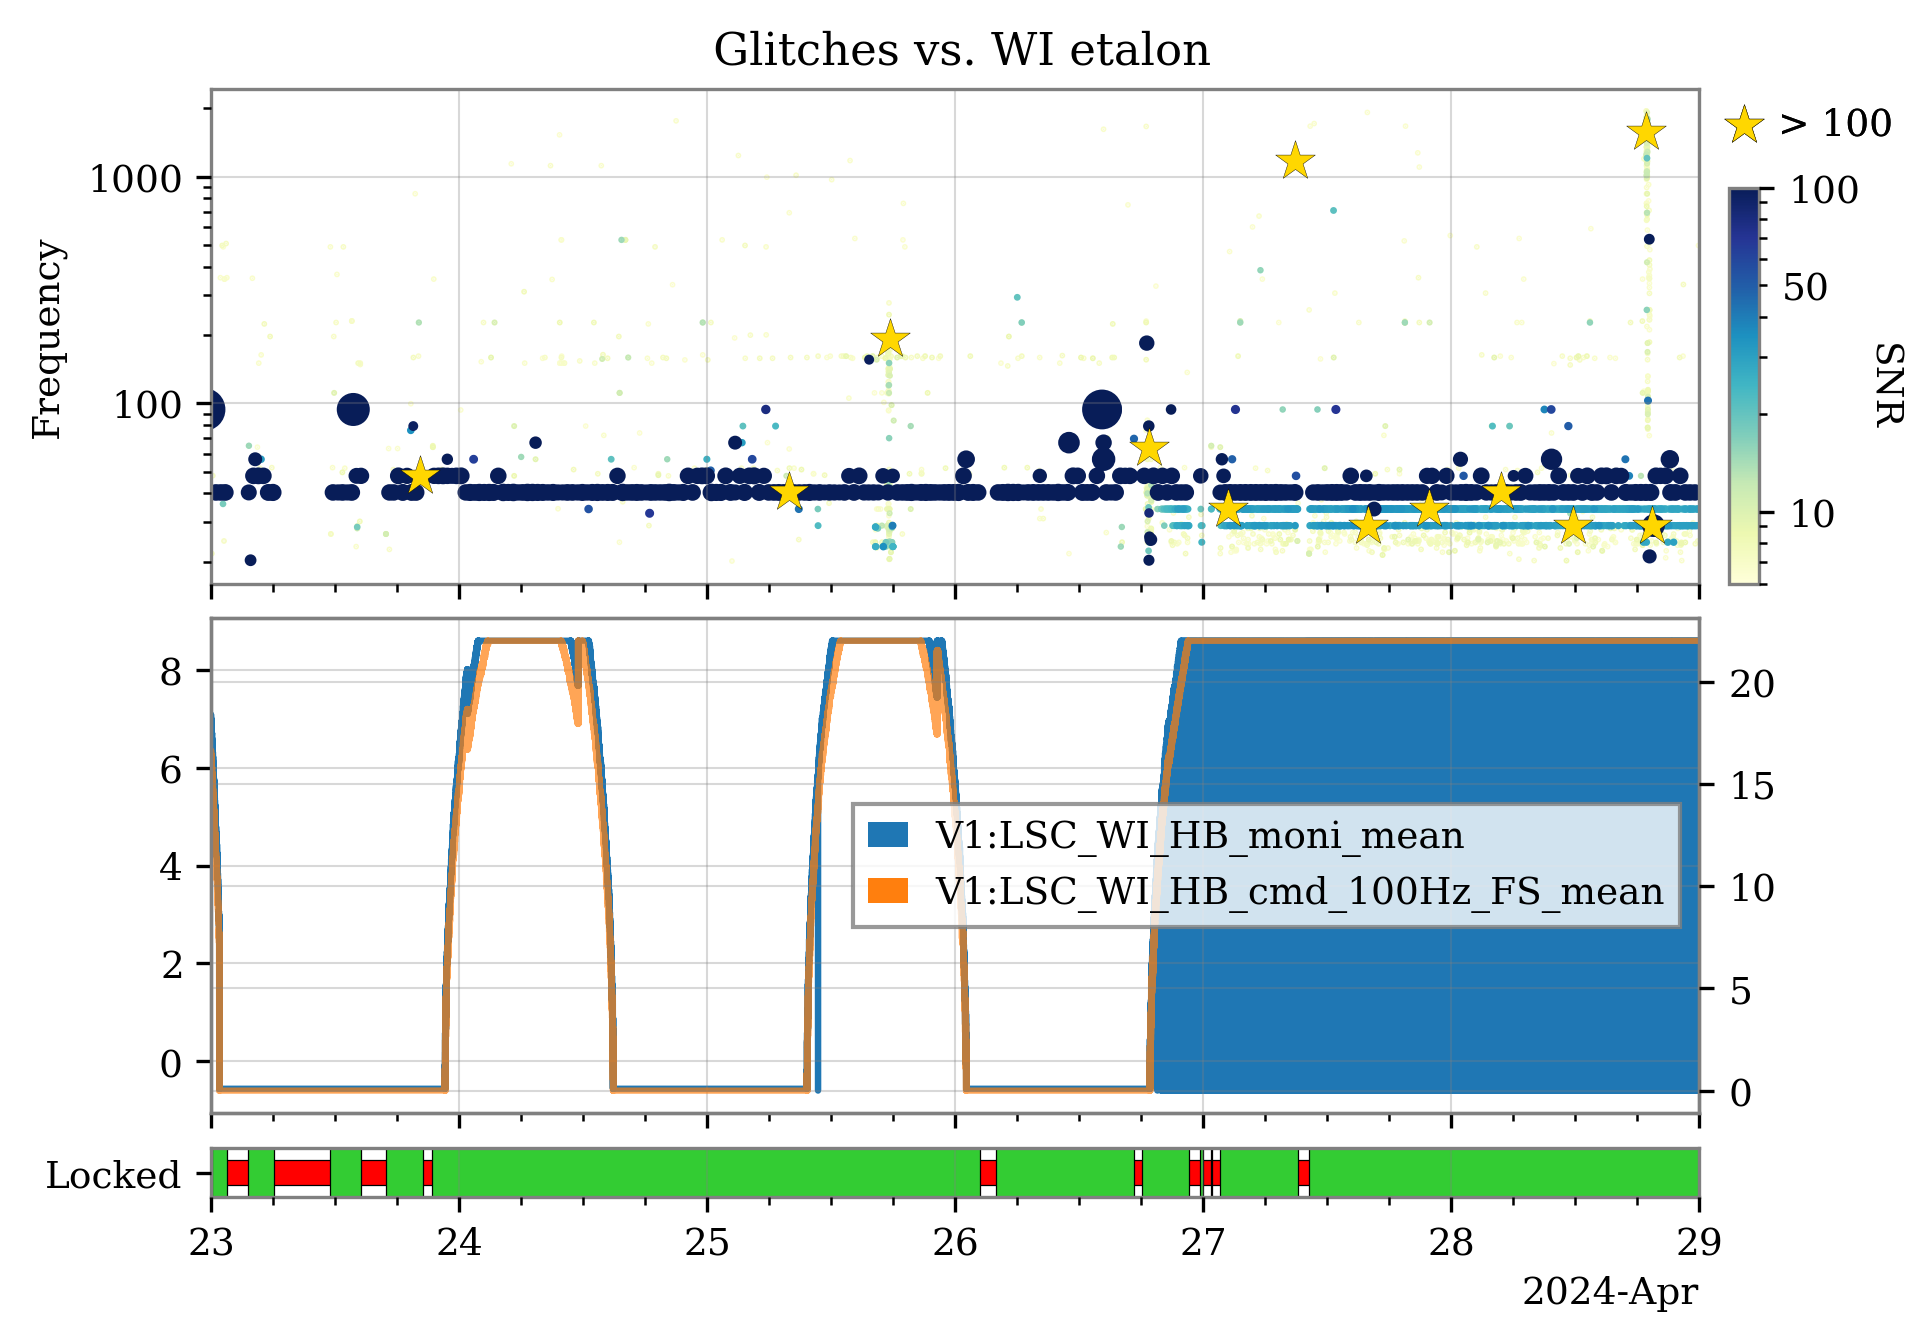
Glitches might have stopped because the WI etalon loop error signal has finally become negative. The loop is asking for cooling the WI tower, which means turning the heating belt off. This switch off didn't happen immediately, but with an on/off for 10 minutes, so it is most likely due to the loop itself and not from an intentional switch off.
I have run a cross-correlation analysis using deltas for each glitch time, and all the _mean and _rms channels from the trend frame. I confirm what was highlighted by Bas in the previous comment:
1) Since April 26 20:00 UTC, the LSC_WI_HB_moni channel has started behaving oddly, with a sequence of square waves from zero to the set point. This is simultaneous with the appearance of the new glitches. The channel monitoring the electric potential, LSC_WI_HB_cmd_100Hz_FS, doesn't present similar behaviour. Figure 1 shows the glitchgram, with the new glitches showing up at the end of Apr 26, and the time series of the two channels monitoring the WI etalon.
2) The glitches in hrec are synchronous with the steps in the square wave visible in LSC_WI_HB_moni.
3) The correlation analysis with the _rms and the _mean trend channels has produced no other correlated channel with these glitches.
Glitches disappeared around 6:45 UTC. Has some action been taken? Indeed, square waves were seen also in the CEB UPS CURR T monitor, as for the old problem with WI heating belts that Bas pointed out.
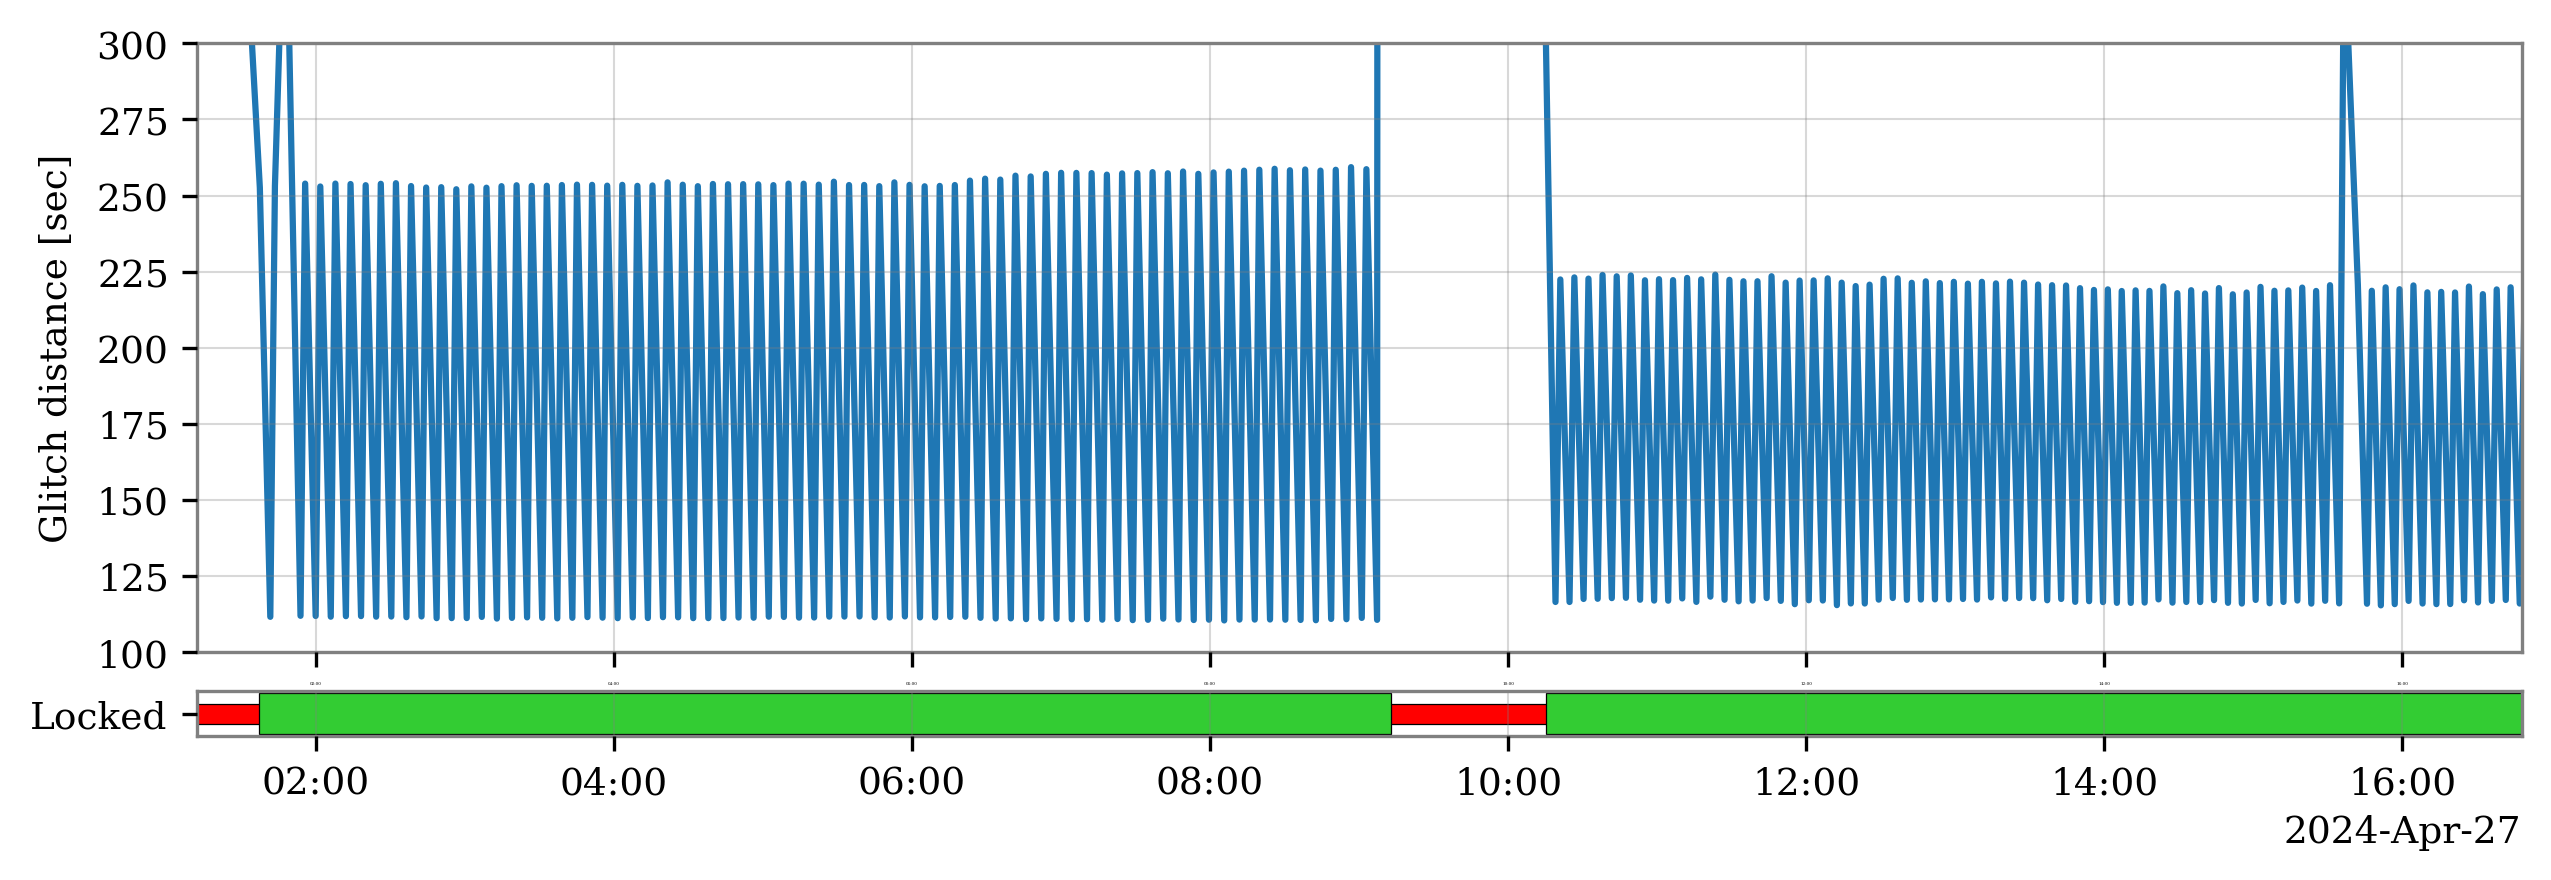
These new glitches seem to originate from some noise source activating for ~2 minutes and off for ~4, similar to a square wave.
First of all, I identified the new glitch family selecting the omicron triggers with peak frequency lower than 40 Hz and SNR between 15 and 60. Then, plotting the temporal distances in the occurrences of consecutive glitches (similarly to what has been done for the 25-minute glitches), I noticed that these alternate between ~115 seconds and 250 or 225 seconds in the examined time interval: figure 1.
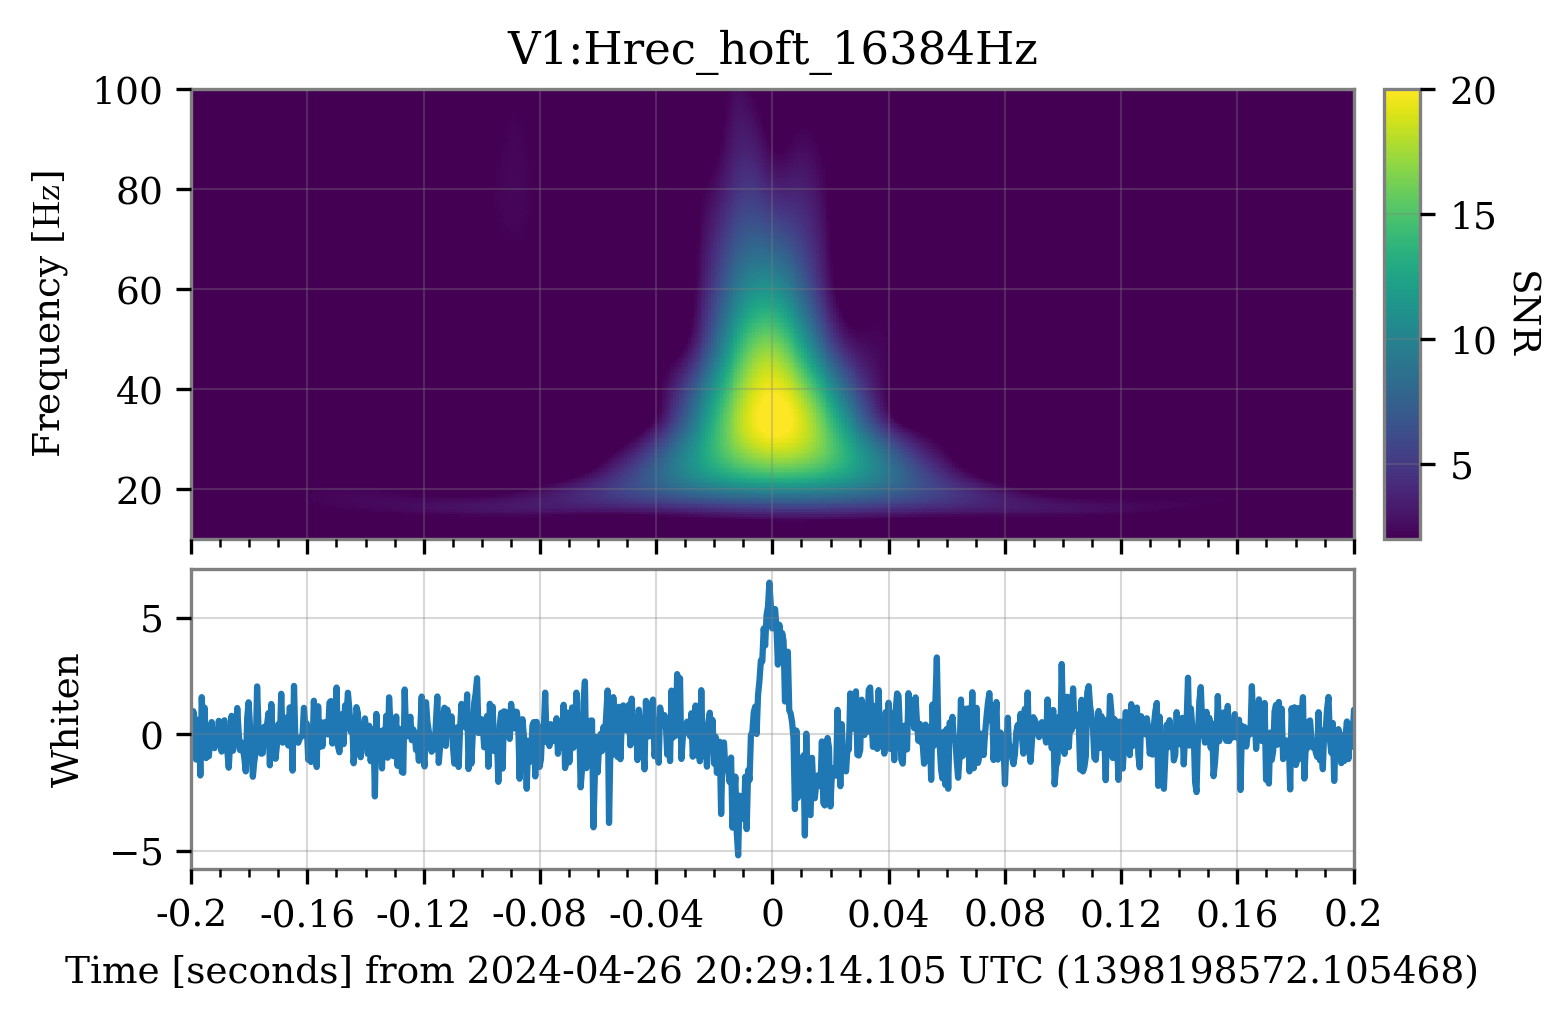
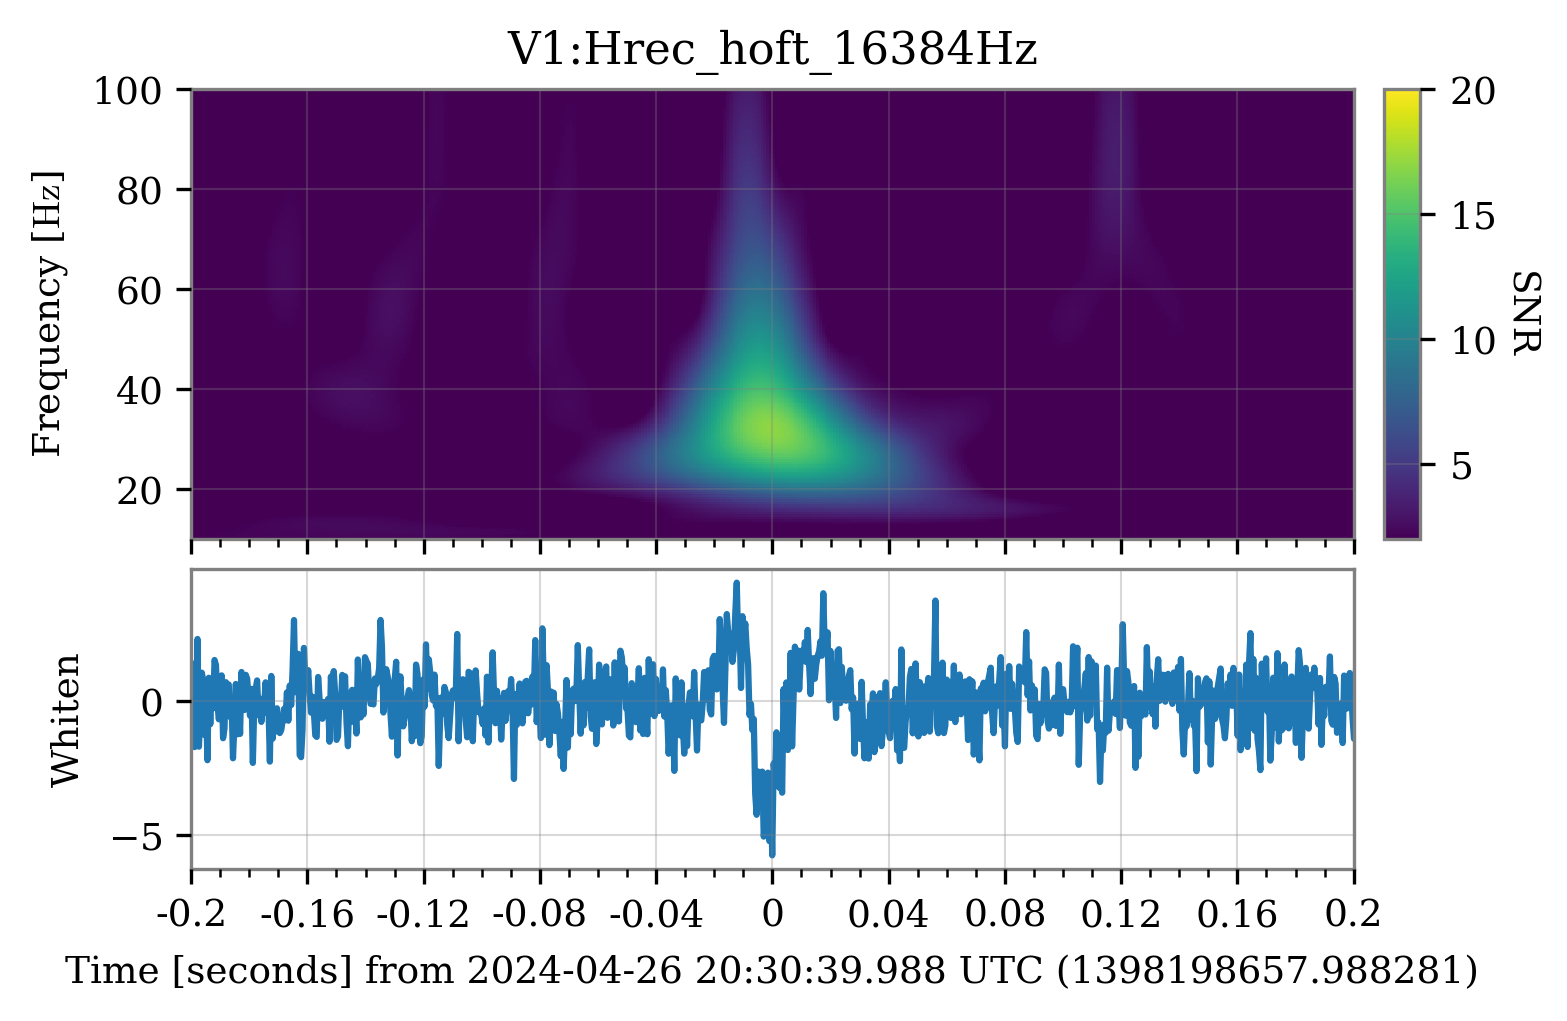
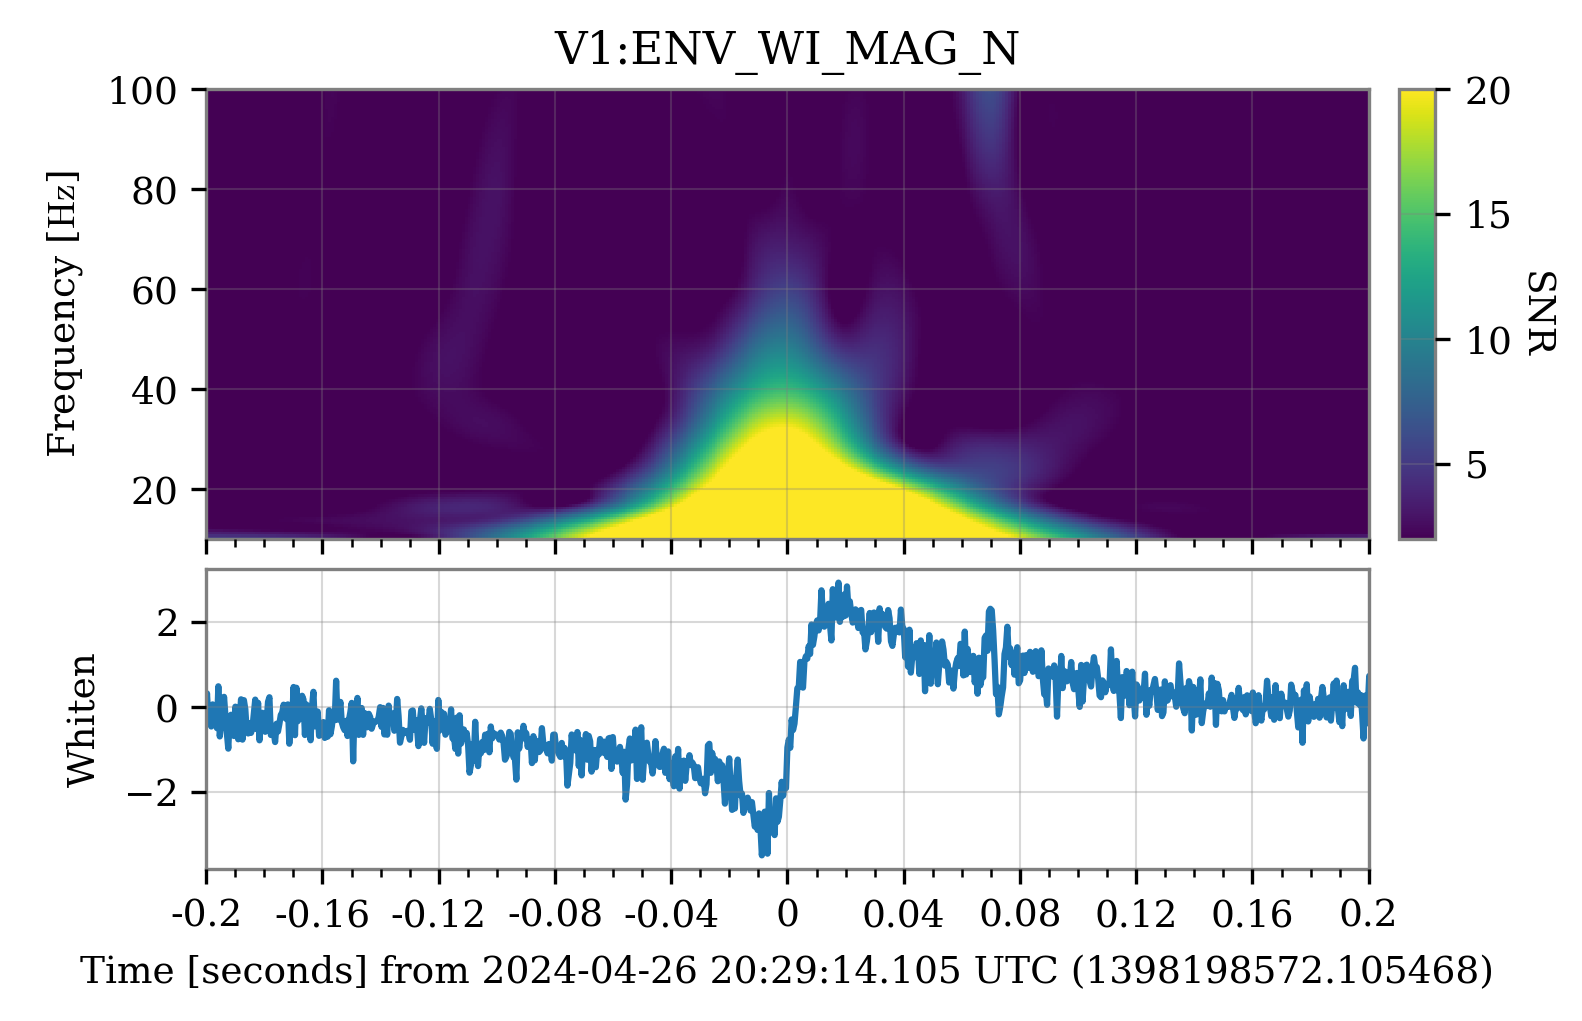
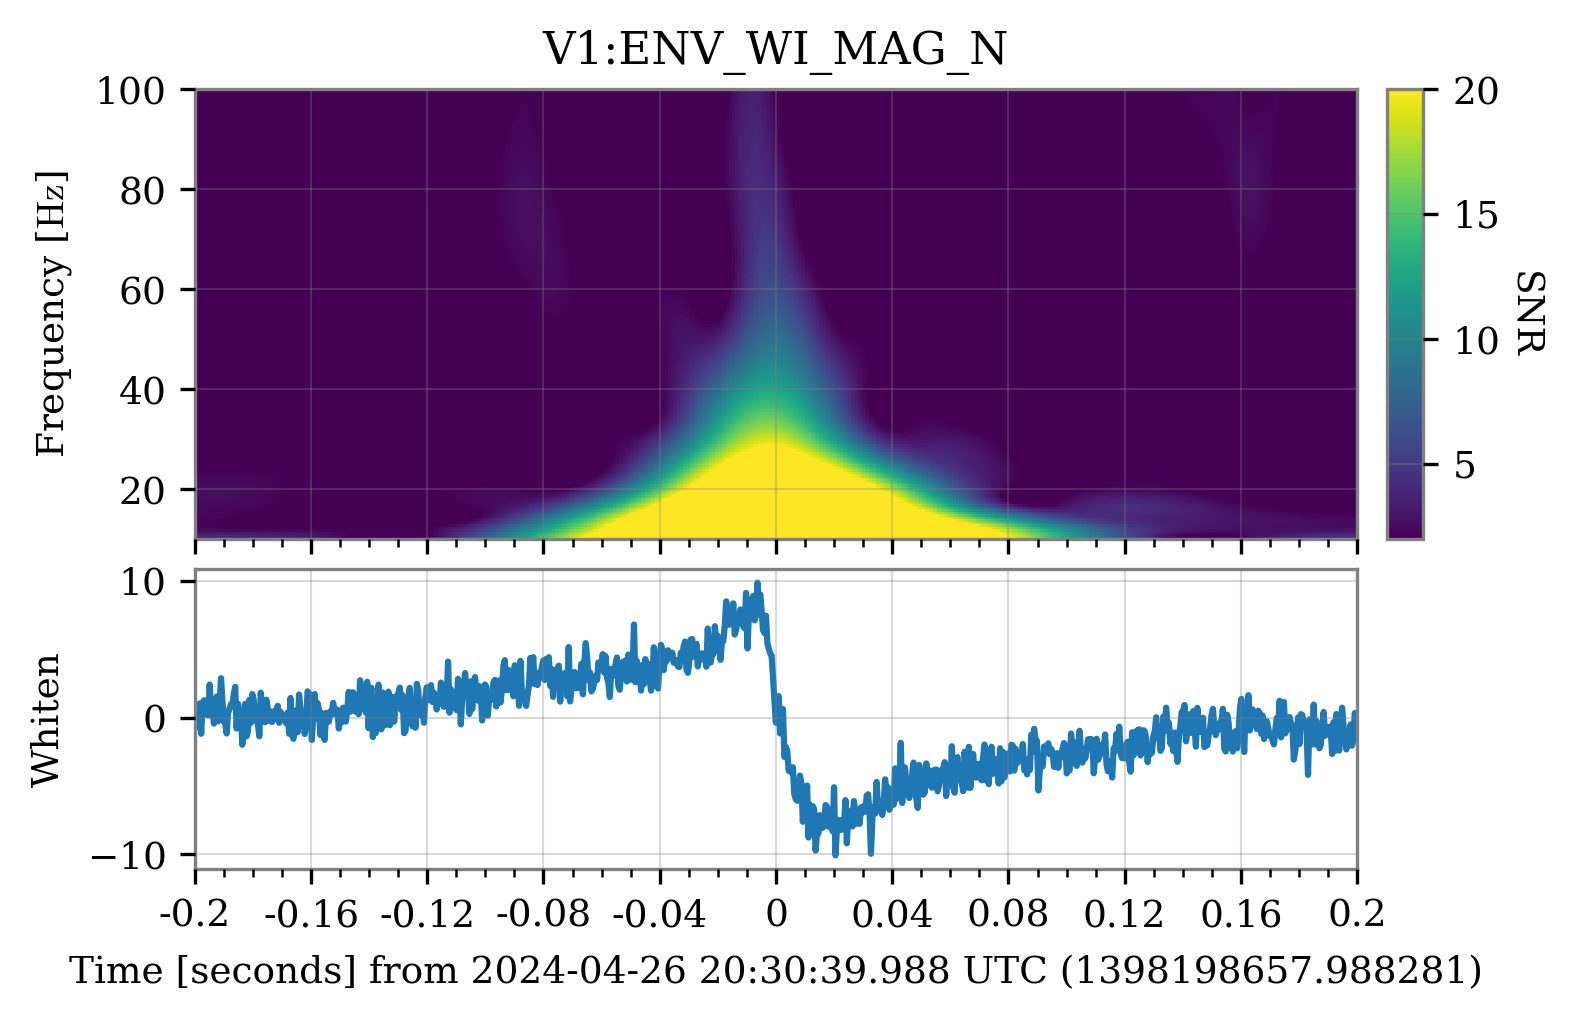
Figure 2 and 3 show the spectrograms of two consecutive glitches in hrec, and their whiten time series. The latter show opposite behaviours, with a spike up in one glitch, followed by a spike down in the next one.
Similar plots for the magnetometers at the West Input, show a step-like behaviour: figure 4 and 5.
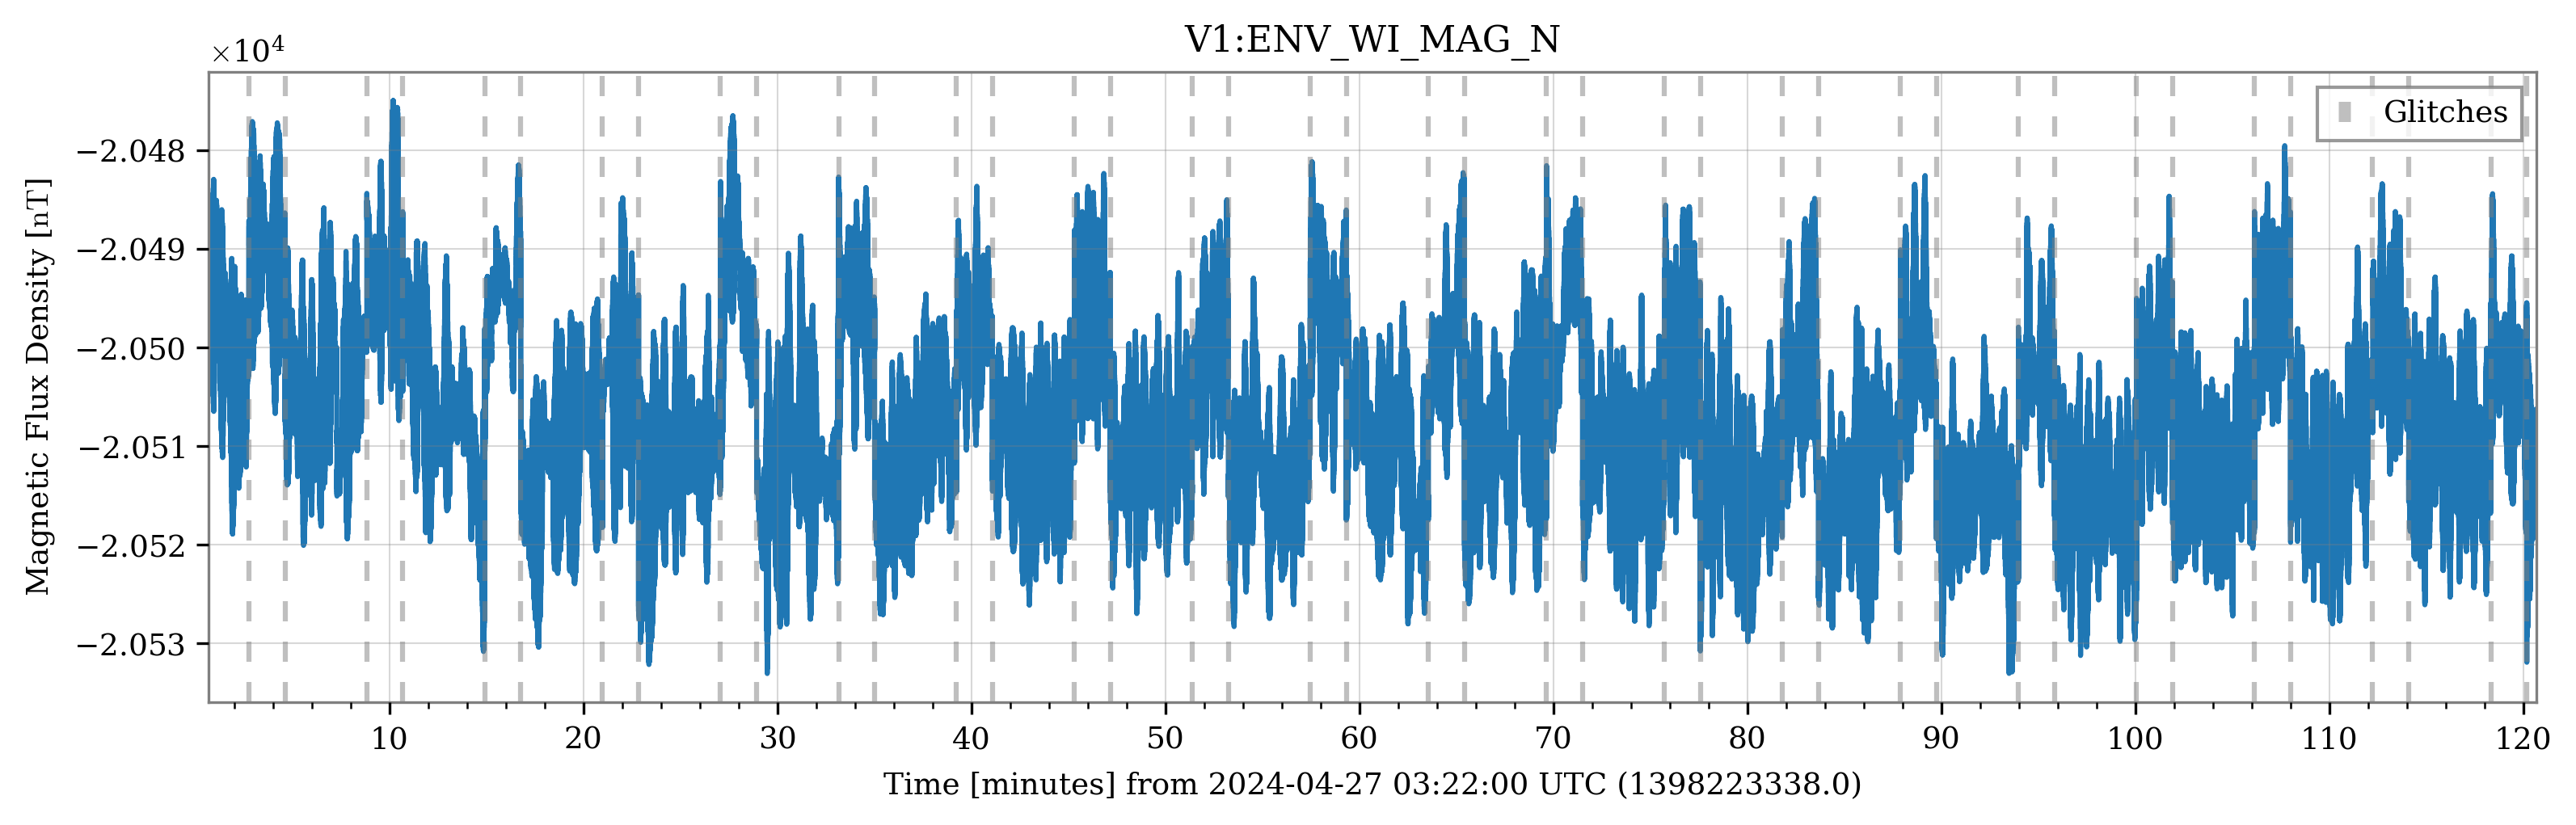
The (non-whitened) time series of this magnetometer channel shows more clearly the square wave behaviour in the correspondence of each pair of glitches: figure 6.
The next task is finding what source is activating with a similar timing.


